Final Project
Objectives
- Apply your data management skills to collect and share data.
- Learn how to design a Shiny application in R.
- Learn basic tools and techniques for connecting your database to an interface. In other words, learn how to create a basic data pipeline.
Project Description
You are working with the city of Portland to organize their annual bicycle count program. Counts will be made by volunteers at various locations throughout the city, who will turn in their count results in paper form. Your job is to design a database and data entry interface which will be used by program staff to record, view, and summarize the count results.
Your team is required to develop a Shiny application for data collection and presentation in R. The interface that you design will include views and controls that can be used to enter and view data, as well as summarize/visualize the data that has been collected.
The collected bicycle count data is provided in the Excel file, P2_Data.xlsx, on Canvas. You will find two spreadsheets describing the count results and locations. Most of the attributes in the tables are self-explanatory, and here are some general descriptions of the data:
- Two-hour counts are made by volunteers at either morning and evening peak hours (7:00AM – 9:00AM or 4:00PM – 6:00PM).
- A total of 16 distinct count fields are provided, one for each unique combination of travel direction and turning movement (e.g. northbound left turn, eastbound through, etc.), and one for each combination of helmet use and gender (e.g. male no helmet, female helmet, etc.)
- The Weather field in the Counts table contains two pieces of information: average temperature and weather description of the typical day. It is assumed that all locations share the same weather condition at a given time.
You may find the following SQL functions useful in extracting one piece of information out from the Weather column:
LEFT(attribute, n)will return the first n characters from each row of an attribute.SUBSTRING(attribute, a, b)will return the a substring from each row of an attribute, where a and b are two integers that specify the start position and length of the substring.- E.g.,
SELECT SUBSTRING('abcdef', 2, 2)will return'bc' LEN(attribute)gives the length of each row of an attribute.- If combine the two functions above,
SUBSTRING(attribute, n, LEN(attribute)+1-n)will give you a substring that starts from the n-th character all the way to the end of the string.
Note: SUBSTRING() is a T-SQL function only supported in SQL Server. In Access, you can use the MID() function which can give you exactly the same result taking the same input parameters.
In addition to the bicycle counts, some volunteers will be collecting data describing trip purpose and cycling habits through in-person surveys. That part of data is not provided in the Excel file, but you will need to create an interface to enter the survey data. Your survey should include:
- Date and time of survey
- Volunteer name: text string
- Location: text string
- Trip purpose: text string
- Trip origin: text string
- Trip destination: text string
- Frequency of bicycle travel: text string
Deliverables
The deliverables for this project are as follows:
- A completed Shiny R application.
- A project report (printed or electronic version) summarizing your work.
- A presentation to be given in class by your group during the final week. How to turn in:
- Turn in your project report in by 11:59 PM on Mar. 18, 2019.
- Make sure that your Shiny application is functional a night before your final presentation.
Requirements
Database
You must include all the information provided in the Excel file into your final database. However, you have some flexibility in your database design. For example, you may combine or split tables to create new relations. You may also consider adding columns to the provided tables to support additional functionality (e.g. image columns to support image uploads). Your objective is to normalize your relations and reduce redundancy in your database.
Note that if you want to first develop your data tables in SQL, you don’t need to create primary/foreign key constraints at the first step. Because your constraints will not be transferred to R when you import tables from SQL.
You are required to create a data entry interface for survey results as a part of your Shiny R application.
Application
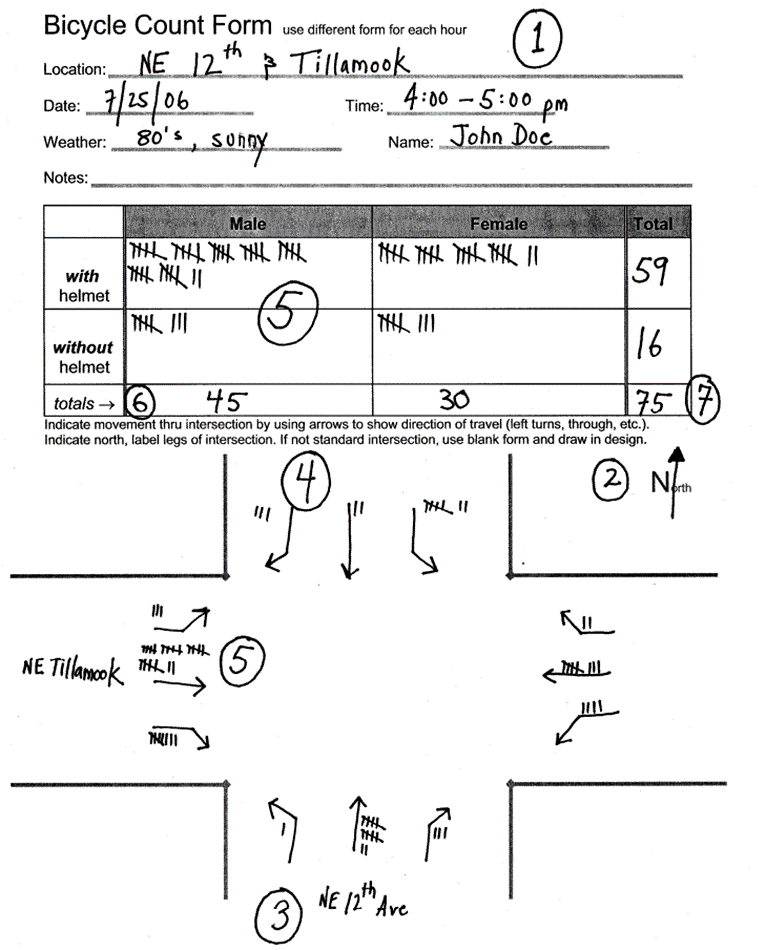
Your application should include a data entry interface for each type of data that may be collected, including counts, new count locations, and surveys. As a reference, an original data form used by Portland Bureau of Transportation is presented in the Appendix. Feel free to design your input interfaces to make them informative to your application users. Note that your input interface should reflect contents in your final data tables.
As much as possible, your design should be intuitive and aesthetically pleasing. You should provide at least one view that can be used to visualize the data that has been collected, which should include some visuals generated from other software you are familiar with (e.g., Excel, R, etc.). You should create at least one parameter query that allow users to view a specific portion of the data based on their input. Optionally, you are encouraged to analyze the collected data using R and provide views to visualize your analysis results.
Project Report
Your project report must include:
- Your team number and the name of each group member;
- A description of the database developed in this project (relational schema and ER diagram);
- A concise user manual that explains attributes in your relations and functions in your Shiny application;
- A link to your Shiny application; and
- Summary of your accomplishment and duties of each team member.
Please be concise in writing the report (suggested length: 6-8 pages).
Presentation:
Each team needs to make a project presentation on Mar. 17 (8:30AM – 10:20AM). Time allowed for each presentation will be 7 minutes. The presentation should cover:
- Design information of your database (show the E/R diagram or relational schemas if necessary); and
- Demonstrate your Shiny application, show off any cool features.
You are not required to prepare a presentation file (e.g. PowerPoint), but if you do want to use one, make sure you send it to me a night before the final presentation.
Grade
30% of your grade for Project 2 will be from your presentation. Everyone in the class, except your teammates and yourself, will evaluate your team’s presentation.
The evaluation criteria include:
- Presentation quality (slides, voice, logic, and expression)
- Design and demonstration of the Shiny application. (easy to use? informative?)
- Extra features: I encourage you to get creative in the function and appearance of your application, as well as in the information you present.
50% of the grade will be from your report and the remaining 20% will be from my evaluation of your completed application (considering that the application has been evaluated in the presentation to some extent).
Note
The data provided for this project, while based on the actual Portland bicycle count, are mostly simulated. It should not be used for any purpose beyond demonstrating the capability of your application. Also, the latitude/longitude fields in the count location table are incomplete and even erroneous. Again, this is intended only to be used for demonstration purposes.
Appendix: Portland Bicycle Count Form